How shifting optimisation from volume metrics to revenue-focused signals changes conversion behaviour, attribution quality, and long-term profitability for eCommerce and B2B funnels.

Image via 123RF
Fill out the form below and our team will get back to you within 24 hours
Discover what makes us different
Our average client sees a 35% lift in conversion rate across 150+ CRO projects.
500+ tests run across landing pages, checkouts and lead capture forms.
Every change is backed by analytics, heatmaps and real session data.
Certified VWO partners running enterprise-grade experimentation programmes.
Here's what sets us apart from the competition
Find answers to common questions
Prebo integrates CRO work with GA4, Google Tag Manager, server-side tracking, and common ecommerce platforms like Shopify and WordPress to ensure accurate event capture and attribution. We also set up ETL or data-layer solutions where needed so test results feed into a single source of truth for decision making.
Common experiments include A/B tests, multivariate tests, funnel experiments, UX and checkout performance optimizations, and technical fixes that reduce friction. Test duration depends on traffic volume and required statistical power but typically ranges from several weeks to a few months per experiment cycle.
We prioritise revenue-per-visitor, conversion rate, average order value, customer acquisition cost (CAC), lifetime value (LTV), and marketing efficiency ratio (MER), alongside statistical significance for experiments. Clean attribution and centralized data pipelines ensure those metrics reflect true business impact rather than platform-reported figures.
CRO is designed to improve conversion efficiency and attribution accuracy, which can increase revenue and profitability when combined with product-market fit and adequate traffic. Outcomes vary by business and depend on test quality, funnel issues identified, and downstream economics, so results are not assured and are measured against revenue-focused KPIs rather than vanity metrics.
CRO is the systematic process of improving a website or funnel to increase revenue per visitor. Prebo Digital uses a technical-first, analytics-driven approach with hypothesis-driven experiments, server-side tracking, and funnel-level optimization focused on measurable revenue outcomes.
In This Article
Revenue-first focus
Accurate attribution
Experiment-driven
Revenue-based optimisation (RBO) reorients measurement and bidding toward monetary outcomes rather than raw conversion counts. For US-based founders, marketing directors, and Shopify stores, this shifts priorities from maximizing form submissions or add-to-carts to increasing the actual $ value per visit or per acquisition. When the optimisation signal includes order value, subscription LTV, or post-purchase revenue, conversion rate changes can look different: you may see fewer counted conversions but higher average order value and improved profitability.
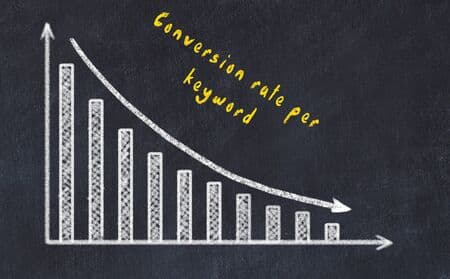
The net result: measured conversion rate (conversions / sessions) can drop if you tighten the definition of a conversion to revenue-qualified purchases, while revenue per session and return on ad spend (measured correctly) increase. This distinction is essential when evaluating performance-relying on platform-reported conversion counts without revenue context can mislead growth decisions.
| Event | Client-side | Server-side | Attribution signal |
|---|---|---|---|
| Purchase | Browser pixel fires with order_id and value | Server-side event enriches with CRM LTV and deduplication | Revenue-weighted last-click / data-driven model |
| Subscription start | Client event | Webhook updates revenue forecast | Projected LTV attribution |
Implementing RBO usually requires a hybrid tracking stack: browser signals for immediate funnel behaviour plus server-side tracking for reliable revenue attribution, deduplication, and integration with systems like Shopify or a B2B billing platform. Prebo Digital’s technical-first approach focuses on clean data pipelines and accurate ROAS tracking; learn about our service mix on the services page.
Practical example (US eCommerce): a Shopify store that moves from optimizing for "add-to-cart" to optimizing for "purchase with AOV ≥ $75" may see session-to-purchase conversion rate fall from 3.2% to 2.4%, while revenue per session rises from $4.80 to $6.40. These numbers are illustrative; your mileage will vary by product and margin structure. To see how a revenue-first measurement plan maps to existing site architecture, explore Prebo Digital’s approach on the homepage.
A structured experiment plan isolates the impact of revenue-based optimisation on conversion rates and unit economics. Common approaches include holdout tests where one cohort remains under the legacy conversion metric while another cohort uses revenue-weighted bids and creatives. Track both raw conversion count and revenue-weighted KPIs (revenue per visitor, CAC to first purchase, projected 90-day LTV).
When moving to revenue-based signals, teams often undercount conversions because platforms flag deduplicated events or stricter conversion definitions. Counter this by documenting event schemas and using server-side receipts to validate revenue. Also consider US privacy laws: California’s CCPA affects tracking and opt-out flows, and cookie consent requirements can impact client-side signals. Implement fallback modelling (e.g., aggregated conversions and probabilistic matching) and record assumptions.
Consideration: use consent-aware measurement like Google Consent Mode combined with server-side enrichment to maintain revenue visibility while respecting user choices.
For technical teams, integrating GA4, server-side GTM, and a CRM or billing system is a priority. If you want a deeper implementation reference, Prebo Digital documents our tracking and analytics strategy on the About page and outlines services that support these systems on the services page.
When communicating results to stakeholders, show both conversion rate trends and revenue per session in the same view. This prevents false conclusions when conversion counts decline but profitability improves. If you would like to model a US-specific example (e.g., a subscription SaaS with $30 monthly ARPU and $300 CAC target), design the experiment to project 90-day revenue impact rather than only first-click conversions. To discuss modelling options, teams often reach out through the contact page.
Here's what sets us apart
Don't just take our word for it
Keep reading
Speak with our conversion optimization experts. Free conversion audit & optimization plan.
Get Free CRO Analysis